Classifiers
This section provides definitions for the various classifiers used by the hm
software and shows how to save a classification to a comma-separated-value text
file. There are two kinds of classifiers: archaeological classifiers that
reflect observations and inferences made by an archaeologist familiar with the
stratigraphic situation represented by the sequence diagram; and graph
theoretical classifiers that take advantage of the DAG representation to deduce
structural relations that might prove useful to the archaeologist tasked with
interpreting the sequence diagram.
The hm software currently implements the following classifiers:
(show-classifiers)
units
levels
phases
periods
adjacent
distance
reachable
Archaeological Classifiers
The hm software currently provides three ways to integrate archaeological
observations about contexts into the sequence diagram, which it calls units,
phases, and periods. Some preliminary discussion is in order because
archaeologists define these terms more or less precisely and have achieved more
or less consensus on their definitions. Also, there are very many other terms
in use that attempt to capture the practice of classifying and grouping
archaeological contexts.
Steve Roskams discusses this situation on pages 257–258 of Excavation in the context of assigning “basic units to higher-order categories.”
This raises the question of how such groups are to be defined—what is the point where one stops and another begins? Should there be a single type of group or a whole hierarchy of entities? How should each be named? Or are the potential configurations so diverse that it is impossible to make useful comparisons between sites?
This issue has been approached by a variety of specialists who have produced different schemes and terminology. To some extent the differences are a function of the great variety of sites with which they are dealing, and are thus entirely legitimate. Equally, they come, in part, from merely giving a different name to the same concept … This profusion of terminology is to be expected, given that thoughts on such matters are at a very formative stage, and it is probably right to retain some diversity in any case, given the variety of sites and associated stratigraphic sequences, and types of analytical procedures applied to them.
The units classification offered by the hm software is more precisely
defined and widely appreciated by archaeologists than either periods or
phases. The hm software recognizes the basic distinction of depositional
from interfacial units of stratification and hard-wires this distinction into
the software, while leaving to the hm user the choice of how it might be
represented in the sequence diagram.
The hm software takes no such confident stand with periods and phases,
leaving their definitions (if not their names within the software) completely up
to the user. From the software’s point of the view, there is no difference
between a period and a phase and there is no relationship between them. The
hm user is best served by viewing them as ways to incorporate any kind of
classification of contexts whatsoever. The classifications might be based on
statistical analysis of the finds collected from each context, presence or
absence of one or more index fossils, physical characteristics of the contexts
themselves, etc.
In a sense, the crucial question from the software’s point of view is how many
different kinds of classification might be useful on a single sequence diagram?
Are two kinds sufficient? The answer to this question does not involve judgments
about how many or few analyses are best carried out on excavation materials.
Rather, it involves how many classifications it might be useful to plot on the
same graphic. If there are a dozen classifications that need to be investigated,
then the way forward is to use the hm software to make 6–12 sequence diagrams,
each one showing one or two classifications, as appropriate.
Units
The units classifier is designed for use with excavation data, where both
depositional and interfacial units are identified and recorded. Archaeologists
universally identify and record depositional units (often as `layers’) but are
somewhat ambivalent about interfaces, typically choosing to record interfaces
that appear to be important and ignoring others.
This practice is potentially problematic for the hm software because it
assumes that interfaces that are not identified and recorded do not themselves
represent chunks of time that might be important in a chronological model. In an
ideal sense, the stratigraphic sequence represents a continuous record of time
from some point in the past represented by the base of excavation up through to
the modern surface. Neglecting to identify and record interfaces potentially
yields a discontinuous model of that continuous record, with gaps introduced by
the time spans represented by the excluded interfaces.
The default configuration file uses node shape to distinguish deposits from interfaces. Deposits are shaped like a rectangular box and interfaces are shaped like a trapezium, as in this snippet from a configuration file:
[Graphviz sequence unit node shape]
deposit = box
interface = trapezium
Individual deposits and interfaces are identified in the input file for contexts (see Section ).
Periods and Phases
The stratigraphic DAG for this example shows the Figure 12 section divided into four periods (fig. 1). The oldest period includes the Natural ground and its surface. The next oldest period includes Context 9 and its surfaces. Next is the once-whole deposit represented by Contexts 7 and 8, the surfaces of those contexts, and all of the various contexts related to construction of the wall stub, Context 5. The youngest period is represented by the Context 1 deposit and its surface.
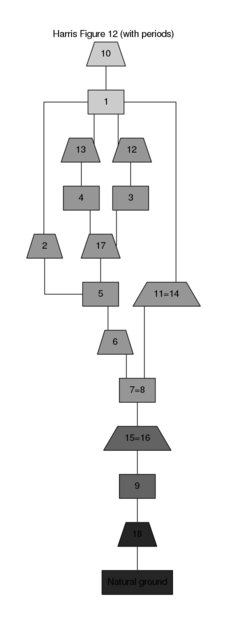
Figure 1: Stratigraphic DAG for the information on Figure assuming inferences of once-whole contexts, and periodized according to the text. Note that rectangular nodes represent deposits and trapeziums represent interfaces.
On a Linux system, Figure 1 can be reproduced with the following function call:
(run-project/example :fig-12-periods)
Graph Theoretical Classifiers
The graph theoretical classifiers are defined in the context of a general definition of a directed graph. The definition used here is paraphrased from the book, Structural Models in Anthropology written by Per Hage and Frank Harary. This book is the first in a remarkable trilogy that also includes Exchange in Oceania: A Graph Theoretic Analysis and Island Networks: Communication, Kinship, and Classification Structures in Oceania.
One of the challenges presented by the literature on graph theory is the number
of synonyms for the basic elements of a graph (table 1), what this
document and the hm software try to label consistently as nodes and arcs. Hage
and Harary typically use point and arc for directed graphs, and point and line
for graphs. The definitions given below and in the following sections are quoted
verbatim, so it is up to the reader to translate synonyms appropriately.
| node | arc |
|---|---|
| point | line |
| vertex | edge |
| junction | branch |
| 0-simplex | 1-simplex |
| element | element |
Hage and Harary define a directed graph on page 68 of Structural Models in Anthropology as follows.
A directed graph or digraph D consists of a finite set V of points and a collection of ordered pairs of distinct points. Any such pair (u, v) is called an arc or directed line and will usually be denoted uv. The arc uv goes from u to v and is incident with u and v.
Adjacent
The adjacency classification is the simplest among the graph theoretical classifications. Following on the definition of directed graph, quoted above, Hage and Harary define adjacency as follows.
The arc uv goes from u to v and is incident with u and v. We also say that u is adjacent to v and v is adjacent from u.
It is important to note that the sequence diagram represents chronological adjacency, rather than physical adjacency. Two contexts that are in contact with one another can be said to be physically adjacent, but they might be chronologically separated by one or more other contexts.
This can be seen in the following example, which is based on the stratigraphic section shown on Figure .
The sequence diagram can be drawn to highlight the relationship of Context 2 to the others. When the sequence diagram is classified so nodes, node labels, and edges are colored according to adjacency from Context 2, such that the origin node is violet, adjacent nodes are cyan, and nodes not adjacent to Context 2 are orange, the graph in Figure 2 results.
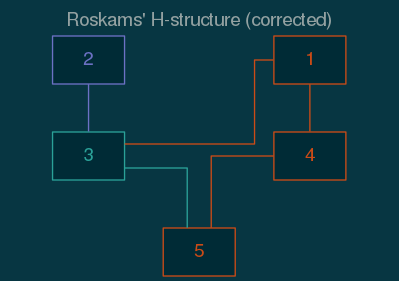
Figure 2: A correct Harris matrix for Figure classified by adjacency to Context 2. Colors are from the Solarized dark palette.
The graph was produced on a Linux system with the following function call:
(run-project/example :roskams-h-solarized-dark)
The important sections in the initialization file include the following.
[Graph analysis configuration]
distance-from =
adjacent-from = 2
...

[Graphviz sequence classification]
node-fillcolor-by =
node-fontcolor-by = adjacent
node-shape-by =
node-color-by = adjacent
node-penwidth-by =
node-style-by =
node-polygon-distortion-by =
node-polygon-image-by =
node-polygon-orientation-by =
node-polygon-sides-by =
node-polygon-skew-by =
edge-color-by = adjacent
...

[Graphviz sequence graph attributes]
colorscheme = solarized
bgcolor = base02
fontname = Helvetica
fontsize = 14.0
fontcolor = base1
label = Roskams\' H-structure (corrected)
labelloc = t
style = filled
size =
ratio = 0.618034
...

[Graphviz sequence node attributes]
shape = box
colorscheme = solarized
style = filled
color = base01
fontsize = 14.0
fontsize-min = 6.0
fontsize-max = 22.0
fontcolor = base01
fillcolor = base03
...

[Graphviz sequence adjacent node colors]
origin = violet
adjacent = cyan
not-adjacent = orange
colorscheme = solarized

[Graphviz sequence adjacent node fontcolors]
origin = violet
adjacent = cyan
not-adjacent = orange
colorscheme = solarized

[Graphviz sequence adjacent edge colors]
origin = violet
adjacent = cyan
not-adjacent = orange
colorscheme = solarized
Note that Context 2 is in physical contact with Contexts 3 and 5. The sequence diagram (fig. 2) shows Context 2 adjacent to Context 3, but because the Context 2 pit cut into Context 3, which itself was cut into Context 5, Context 2 is not chronologically adjacent to Context 5.
Reachable
The graph theoretic definition of reachability requires definitions for directed walk and path. Hage and Harary define reachability this way on pages 68–69 of Structural Models in Anthropology, where they use digraph as a synonym for directed graph.
A (directed) walk in a digraph is an alternating sequence of points and arcs, v₀, x₁, v₁, …, xₙ, vₙ in which each arc xᵢ is vᵢ₋₁vᵢ. For brevity, we may write the sequence of points v₀, v₁, …, vₙ to indicate the same walk. The length of such a walk is n, the number of occurrences of arcs in it. A closed walk has the same first and last points, and open walk does not, and a spanning walk contains all the points. A path is a walk in which all points are distinct; a cycle is a nontrivial closed walk with all points distinct except the first and last. If there is a path from u to v, then v is said to be reachable from u …
Compare this definition with Roskams’ description of reachability as it is conceptualized by users of the Harris matrix on page 158 of the book, Excavation:
if one travels from a particular unit via the strands running up from it, all units through which one passes are provably later than that unit; if one travels down, every unit en route is provably earlier; any unit which cannot be reached in one of these two ways has no proven relationship with the unit in question.
This describes all the nodes from which the “particular unit” is reachable—”the strands running up from it”—and all the nodes reachable from “the particular unit” that are encountered when one “travels down”.
One key to dating Çatalhöyük has been identifying residual materials in the deposits. A good example of this is Context 1332+, where several seeds were recovered and dated. Initially, the seeds were thought to be associated with the Context 1332+ deposit, but four of them were subsequently determined to be residual. The effect of these different residuality determinations on the dating project at Çatalhöuyük is discussed by Dye and Buck.
The importance of Context 1332+ in the stratigraphy of Çatalhöyük is indicated
by a graph classified by reachability (fig. 3).
This graph assigns dark blue fills to nodes from which Context 1332+ is
reachable and nodes reachable from Context 1332+. The node for Context 1332+ is
filled light blue. Nodes from which Context 1332+ is not reachable and nodes not
reachable from Context 1332+ are filled green. The colors are taken from the
Brewer color paired palette.
A stratigraphic DAG for the information displayed on Figure 3
might be drawn on a Linux system with the hm software as follows:
(run-project/example :catal-hoyuk-reachable)
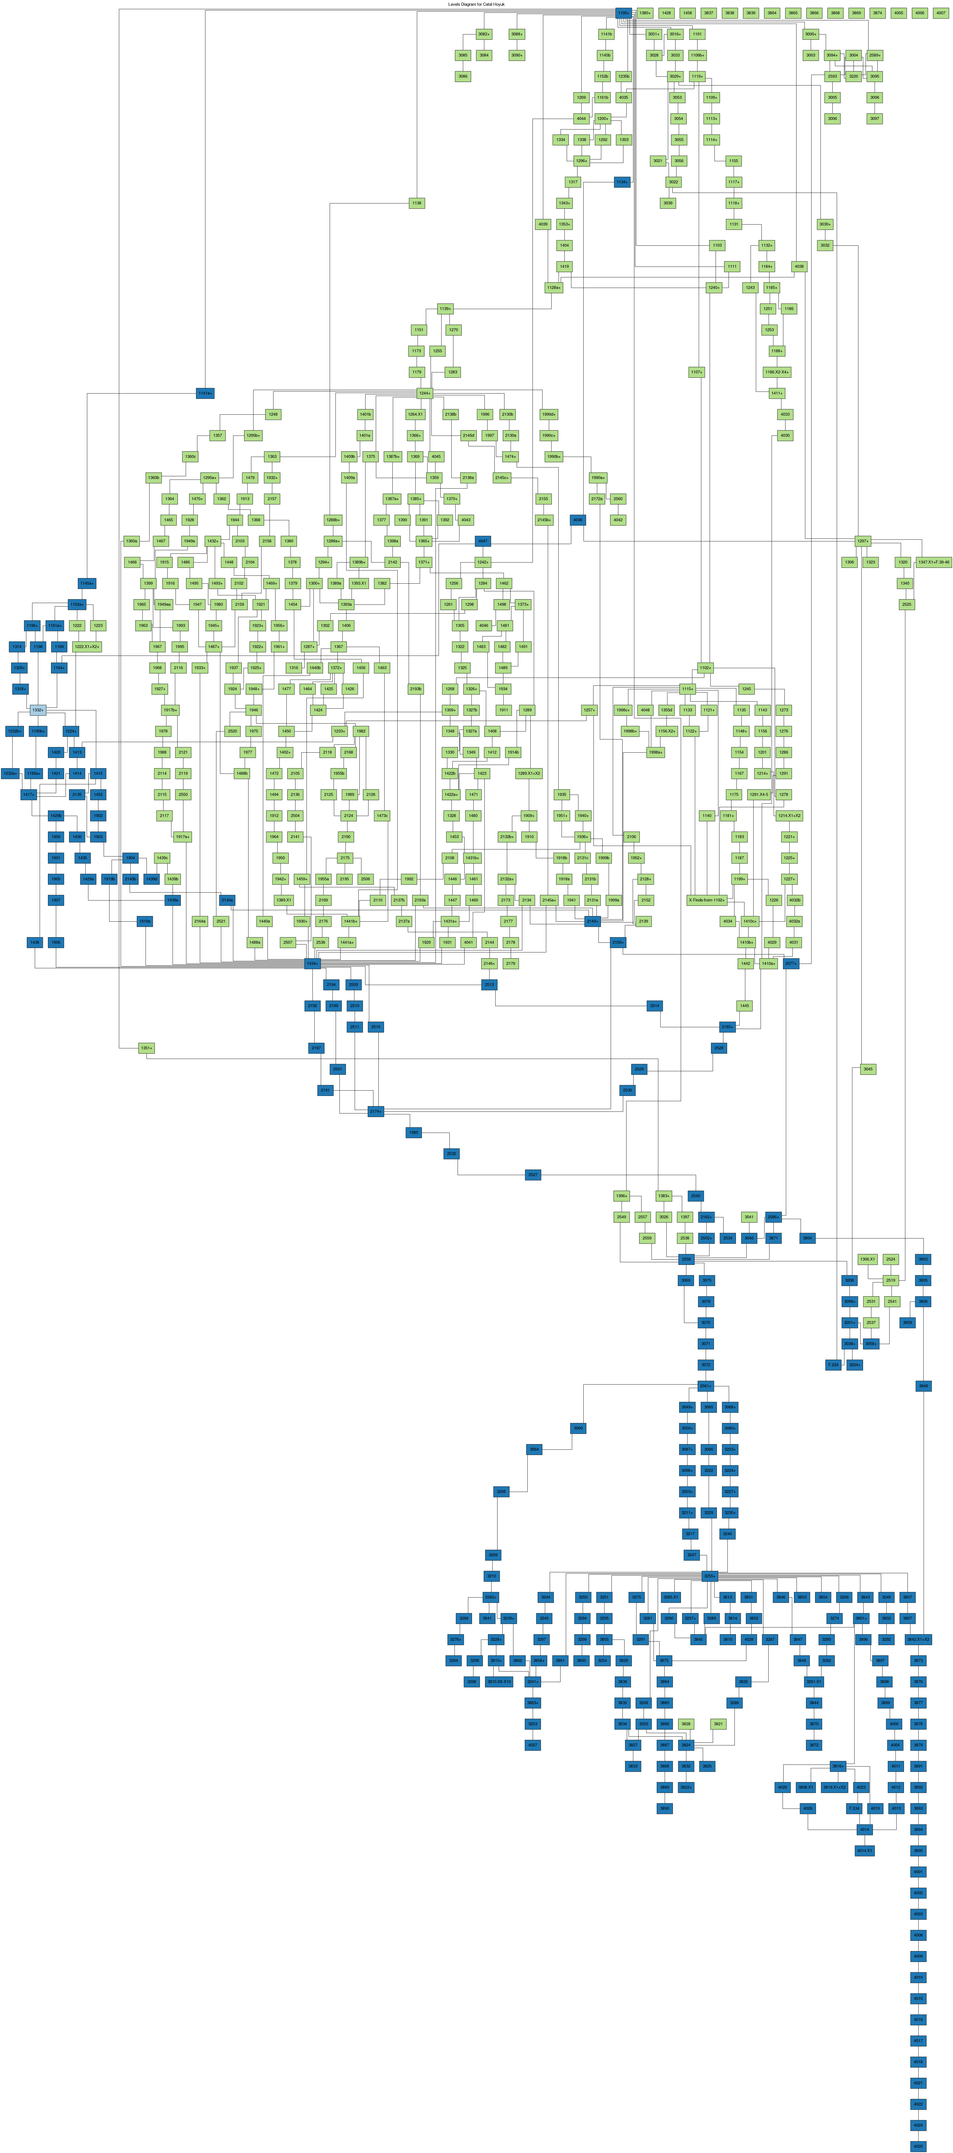
Figure 3: Stratigraphic DAG of the North Area sequence with nodes classified according to reachability to and from Context 1332+. Context 1332+ is light blue. Nodes reachable from Context 1332+ are dark blue. Nodes not reachable from Context 1332+ are green.
The important sections of the configuration file include the following.
[Graph analysis configuration]
distance-from =
adjacent-from =
reachable-from = 1332+
reachable-limit =

[Graphviz sequence classification]
node-fillcolor-by = reachable
...

[Graphviz sequence reachability node fillcolors]
origin = 0
reachable = 1
not-reachable = 2
colorscheme = paired
Classification by reachability is potentially important for decisions on what materials to date. Contexts that are reachable from many contexts or from which many contexts are reachable might be thought of as having relatively great potential influence in a chronological model.
Distance
The graph theoretic definition of distance follows directly on the definition of reachability. Hage and Harary define distance this way on page 69 of Structural Models in Anthropology.
If there is a path from u to v, then v is said to be reachable from u, and the distance d (u,v) from u to v is the length of any shortest such path.
An example of a graph classified by distance is Figure 4. This graph assigns node fills based on distance from Context 1332+. The node for Context 1332+ is the lightest blue. Nodes not reachable from Context 1332+ are the darkest blue. All other nodes have intermediate shades of blue based on their distance from Context 1332+, the farther the node the darker the color.
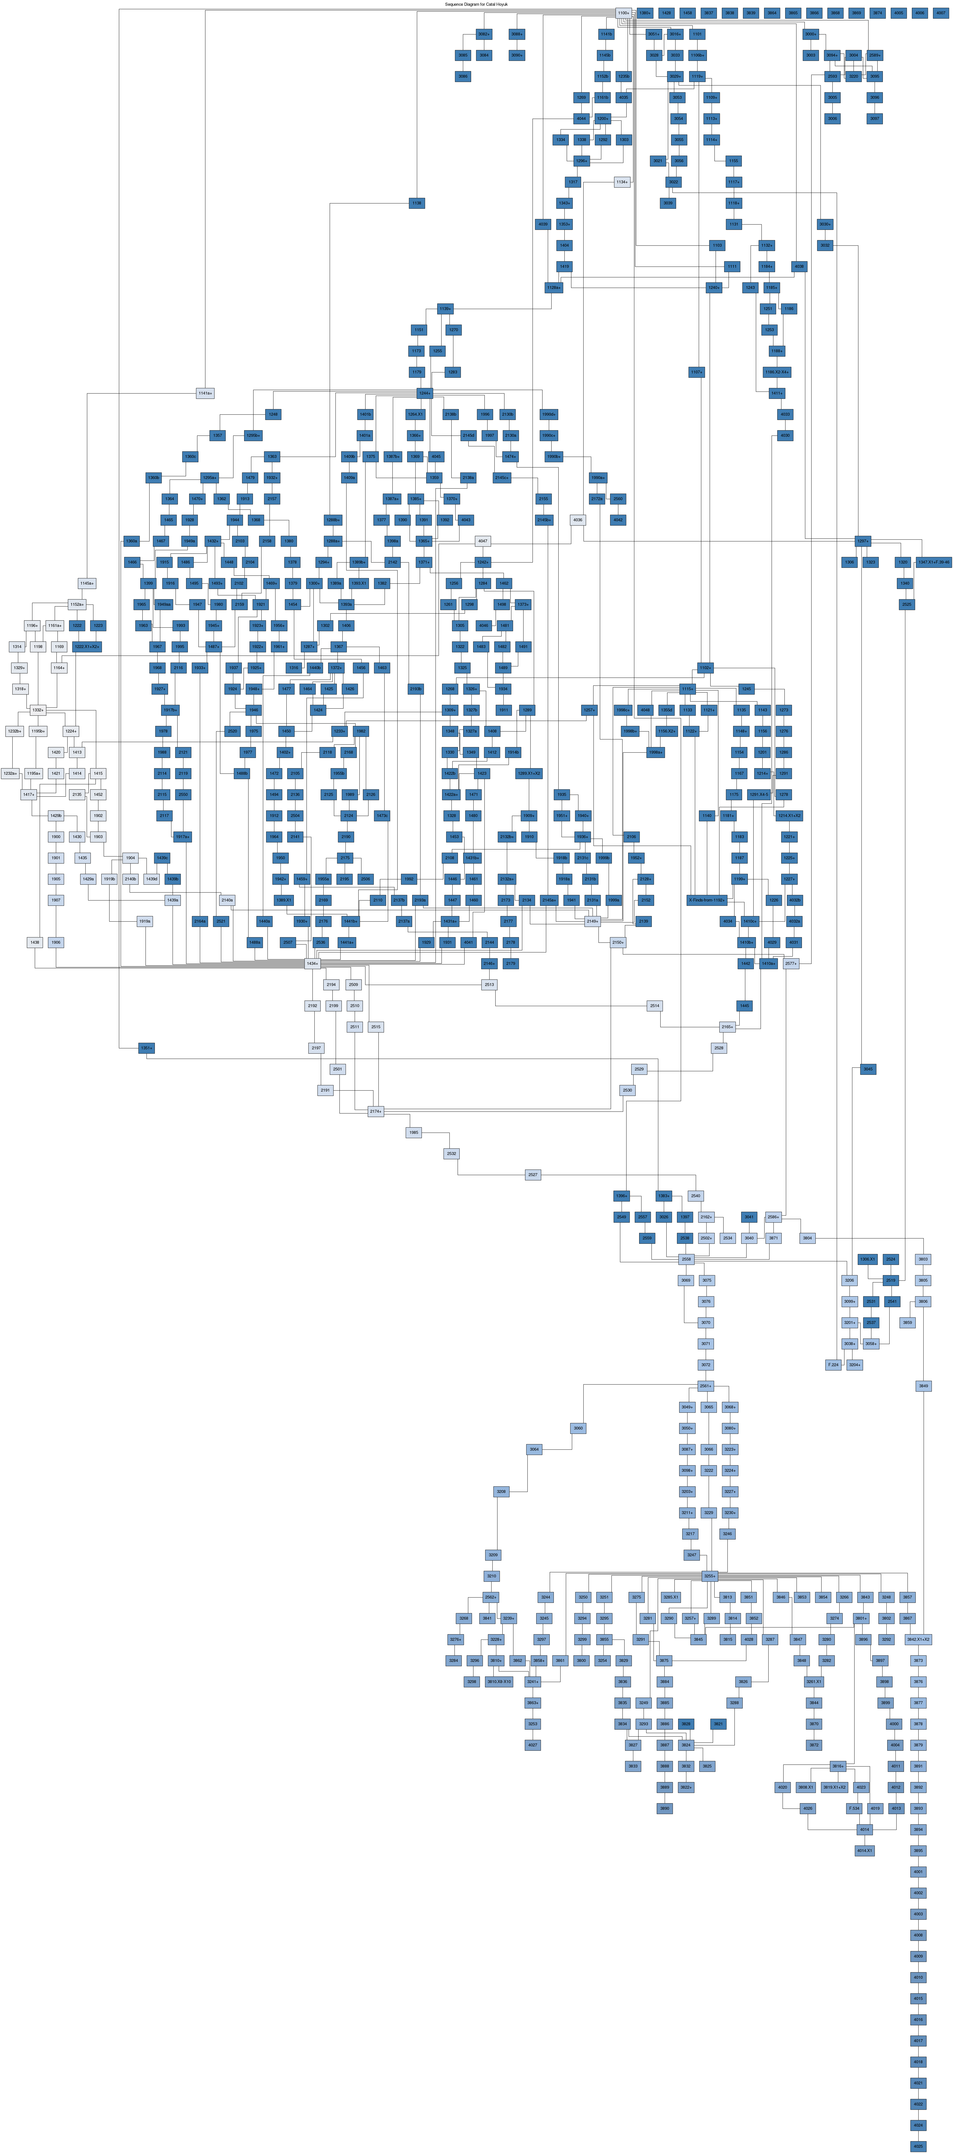
Figure 4: Stratigraphic DAG of the North Area sequence with nodes shaded by distance from Context 1332+.
This graph was produced on a Linux system with the following function call:
(run-project/example :catal-hoyuk-distance :draw-chronology nil)
The interesting parts of the configuration file follow.
[Graph analysis configuration]
distance-from = 1332+

[Graphviz sequence classification]
node-fillcolor-by = distance

[Graphviz sequence node fill color schemes]
levels =
distance = cet-blues
Levels
The graph theoretic concept of level is closely tied to the stratigraphic concept of level. Hage and Harary define level on page 82 of Structural Models in Anthropology.
An acyclic digraph D has no cycles … [and] is said to have a level assignment, which assigns a positive integer n for each point v, called its level, if for each arc vᵢ vⱼ of D, the corresponding integers satisfy nᵢ < nⱼ. Thus each arc of D is directed from a lower to a higher level. If a digraph D has a cycle, then it cannot have a level assignment.
An example of a levels classification can be seen in the stratigraphic DAG of Çatalhöyük (fig. 5).
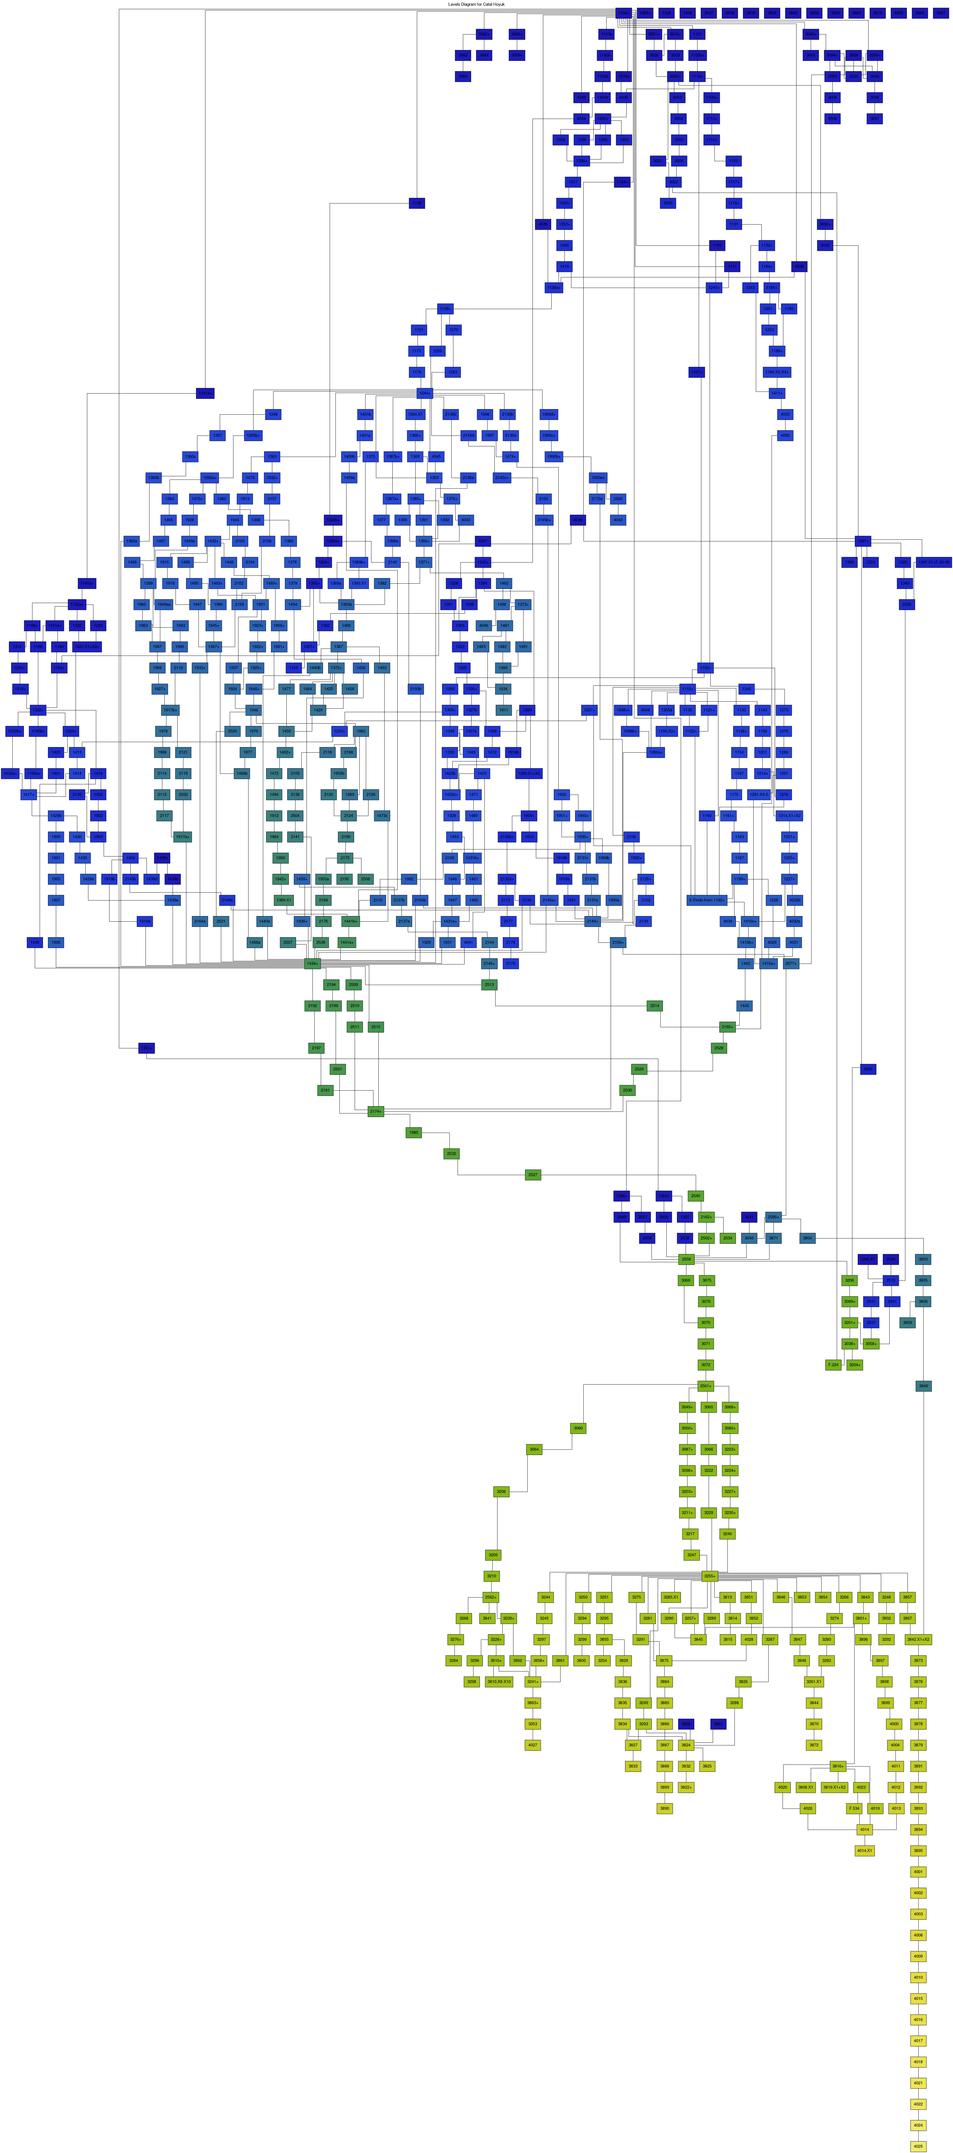
Figure 5: Stratigraphic DAG of the North Area sequence at Çatalhöyük with nodes colored by level.
The graph was produced on a Linux system with the following function call:
(run-project/example :catal-hoyuk-levels :draw-chronology nil)
The interesting parts of the configuration file follow.
[Graphviz sequence classification]
node-fillcolor-by = levels

[Graphviz sequence node fill color schemes]
levels = cet-bgyw
Write a Classification to a File
In addition to creating graphical output, the hm software can write a
classification to a comma-separated-value file to communicate with other
software. The name of the output file is specified in the configuration file;
this protocol insures that the user of an hm project created by someone else
can be certain of a CSV file’s contents.
In the example below, the file names for distance, reachable, and adjacent
classifications are helpfully descriptive, while the name given the phases
classification is not too helpful.
[Output files]
sequence-dot = fig-12-polygon-1.dot
chronology-dot =
distance = fig-12-distance.csv
reachable = fig-12-reachable.csv
adjacent = fig-12-adjacent.csv
phases = foobar.csv
periods = fig-12-periods.csv
...
The following transcript writes the periods classifier for the
:fig-12-polygon example to the fig-12-periods.csv file.
(defvar *seq*)
(setq *seq* (run-project/example :fig-12-polygon))
(write-classifier :periods *seq*)
The file fig-12-periods.csv file looks like this:
head ../examples/fig-12-chronology/fig-12-periods.csv