Example Projects
The hm software comes with example projects to illustrate some of its
capabilities. You can find these in
<path-to>/quicklisp/local-projects/harris-matrix/examples/. Each of the
projects includes the necessary input and configuration files, which can be used
as examples for your own work.
Harris’ Figure 12
“The compilation of a stratigraphic sequence” is the iconic representation of how one goes about constructing a Harris matrix by identifying contexts and observing their relationships to one another. Published as Figure 12 in Edward Harris’ book Principles of Archaeological Stratigraphy, the figure illustrates the Harris matrix practice of identifying all deposits and selecting a subset of interfaces for identification. Figure 1 shows the stratigraphic section at the top left of Harris’ Figure 12 redrawn to include eight interfacial contexts not identified in the original.
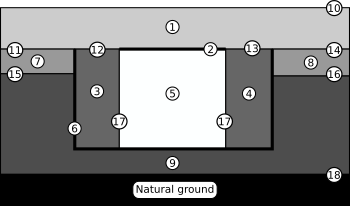
Figure 1: The stratigraphic section from Figure 12 in Principles of Archaeological Stratigraphy. Note that interfaces 10–18 were not identified in the original.
A stratigraphic DAG for the information displayed on Figure 1 might
be drawn on a Linux system with the hm software as follows:
(run-project/example :fig-12)
This example produces the graphics file shown as Figure 2.
In this example, all of the contexts are displayed and inferences of once-whole
contexts are not taken into account. This directive is set by the value of
assume-correlations.
[General configuration]
chronology-graph-draw = off
project-directory = ~/quicklisp/local-projects/harris-matrix/examples/fig-12-chronology/
legend = off
assume-correlations = no
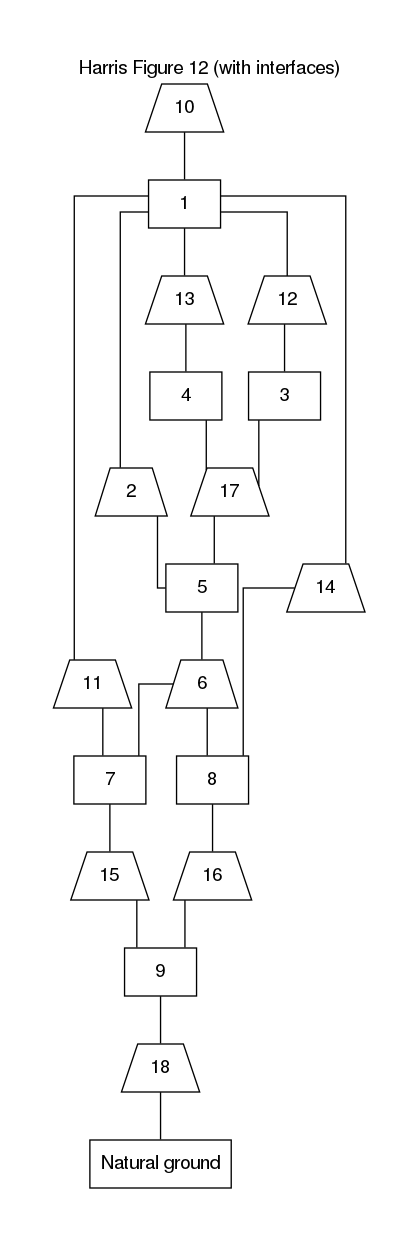
Figure 2: Stratigraphic DAG for the information on Figure 1.
As described by Dye and Buck, the stratigraphic DAG is not able to represent all of the information potentially represented on a Harris matrix. Instead, two stratigraphic DAG’s are required. Figure 3 shows the stratigraphic DAG that results when inferences of once-whole contexts are assumed true.
A stratigraphic DAG for the information displayed on Figure 3
might be drawn on a Linux system with the hm software as follows:
(run-project/example :fig-12-correlations)
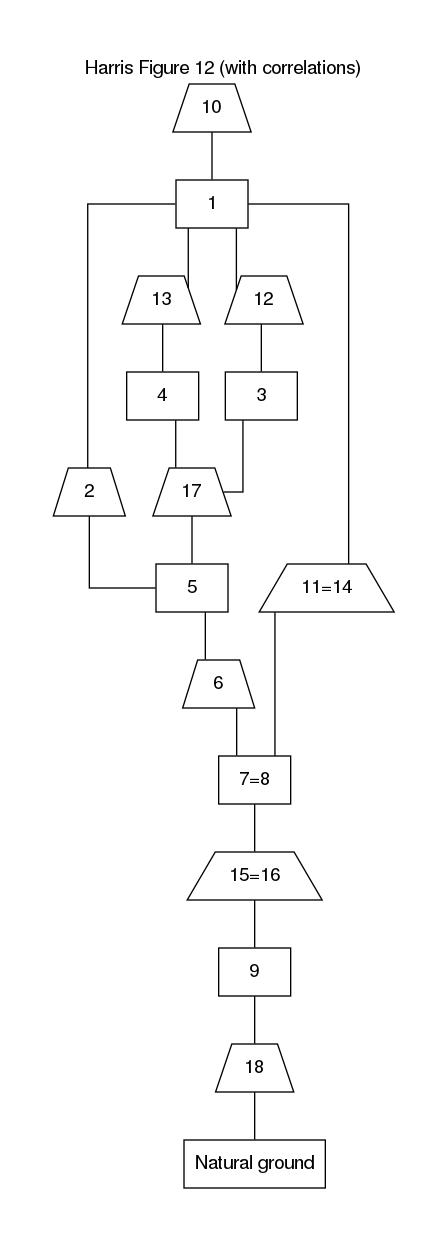
Figure 3: Stratigraphic DAG for the information on Figure 1 assuming inferences of once-whole contexts.
The interesting part of the configuration file is the setting for
assume-correlations.
[General configuration]
chronology-graph-draw = off
project-directory = ../examples/fig-12-chronology/
legend = off
assume-correlations = yes
Roskams’ H-structure
“Avoiding a common error in Harris matrix construction,” is an example of an H-structure from Figure 14 of Steve Roskams’ Cambridge Manual in Archaeology, Excavation. The H-structure is a common source of error in a Harris matrix that is said to “creep in when the lines drawn to the base of an overlying unit are not split but enter as single lines” (p. 159).
The problem is illustrated in Figure 4, which shows a stratigraphic section with five contexts, labeled 1–5. Contexts 1–4 are each pits excavated, at least partially, into the general matrix, Context 5. The first pits excavated were Contexts 3 and 4. It is not possible to order them based on the information in the stratigraphic section. Later, the Context 1 and 2 pits were excavated. The Context 1 pit cut into Contexts 3, 4, and 5. The Context 2 pit cut into Contexts 3 and 5.
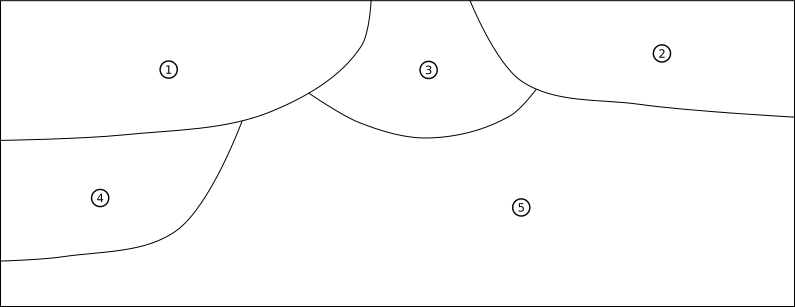
Figure 4: Hypothetical stratigraphic section, drawn after Figure 14 in Steve Roskams’ book, Excavation.
The problem arises if the Harris matrix is drawn carelessly to indicate a stratigraphic relationship between Contexts 2 and 4. The mistake manifests itself as a set of edges that form the letter H, as shown in Figure 5. The incorrect Harris matrix indicates that Context 2 is younger than Context 4, when in fact that relationship cannot be determined.
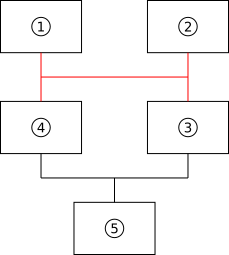
Figure 5: Incorrect Harris matrix for the stratigraphic section shown in Figure 4. The H-structure is drawn in red.
A correct Harris matrix for the stratigraphic situation displayed on Figure
4 might be drawn on a Linux system with the hm software as follows:
(run-project/example :roskams-h)
The correct Harris matrix drawn by this command is shown on Figure 6.
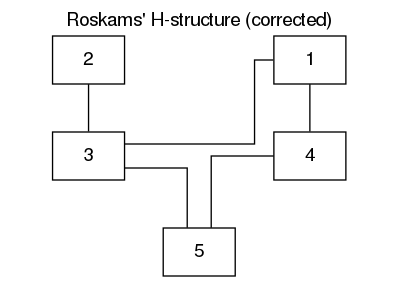
Figure 6: A correct Harris matrix for Figure 4 drawn by the hm software.
Roskams’ Jumps
Steve Roskams discusses a practical difficulty encountered during construction of the Harris matrix on pages 158–159 of Excavation, where one line “jumps” over another. Roskams describes a situation where the Harris matrix cannot avoid a jump.
The stratigraphic situation … [(fig. 7)] comprises a rubble foundation 7, overlain by timber sills 5 and 6, with each sill capped at one end with a leveling tile, 3 and 4 respectively, before these tiles were themselves overlain by another timber 2 … However if a second timber 1 also overlay sills 5 and 6, its position in the matrix cannot be represented accurately without implying a false relationship with either 3 or 4. Here it is necessary to use a drawing convention to show one line `jumping’ another …
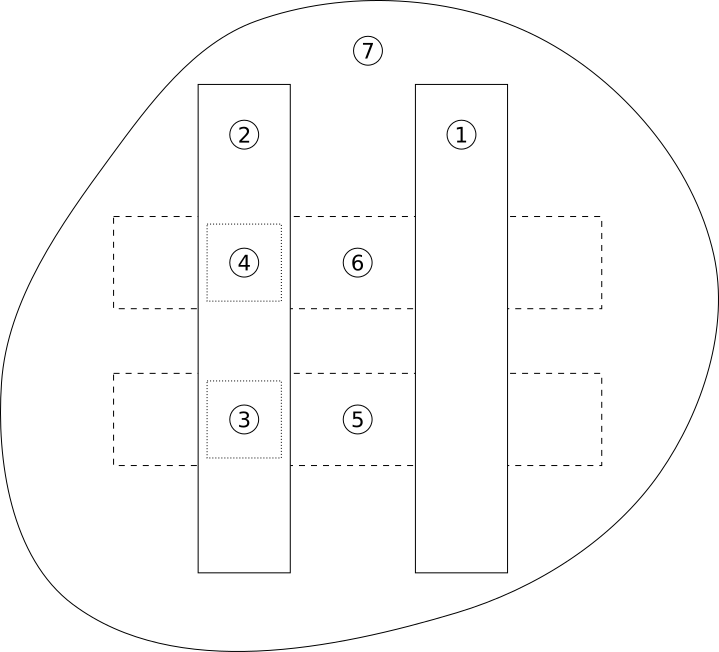
Figure 7: Hypothetical plan view drawn after Figure 13 in Steve Roskams’ book, Excavation.
The layout of the stratigraphic DAG is more flexible than a Harris matrix, so this stratigraphic situation can be drawn without any `jumps’. The stratigraphic DAG can be illustrated with this command:
(run-project/example :roskams-jumps)
The nodes of the DAG are placed in such a way that there is no question about the chronological relationship of Context 1 with Contexts 3 or 4 (fig. 8).
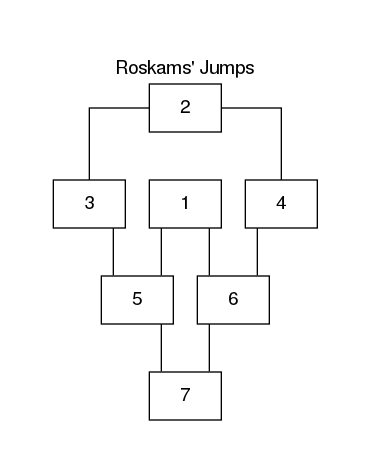
Figure 8: Stratigraphic DAG illustrating the situation illusrated in Figure 7.
Herzog and Scollar’s Complex H-structure
An “H-structure” is a potentially ambiguous layout in a Harris matrix (see Sec. Roskams’ H-structure). The example described in this section comes from Figure 9.5a of a 1991 paper by Irmela Herzog and Irwin Scollar, “A new graph theoretic oriented program for Harris Matrix analysis” that was presented to the Computer Applications and Quantitative Methods in Archaeology 1990 Conference. Herzog and Scollar were describing a component of Version 4 of the Bonn Seriation and Archaeological Statistics Package.
The Bonn program was able to resolve single H-structures, but complex combinations of H-structures could not always be resolved satisfactorily. This example describes a complex combination of H-structures, of a kind that could not be plotted by the program without potentially ambiguous `crossings’. The situation is described on page 57 of their article, as follows.
It is quite difficult to include crossings in the diagram. There are cases when quite a few lines corresponding to crossing relations extend over the full breadth of the diagram. This certainly does not enhance the readability of the diagram. Therefore crossings are currently not plotted. Any layer that has a crossing relation is marked with a double frame. A list of relations which could not be displayed is generated at the bottom of the diagram.
The example in Figure 9.5a of their paper consists of nine contexts with relations described as follows.
1 overlies: 5, 6. 2 overlies: 5, 6, 7, 8. 3 overlies: 7, 8. 4 overlies: 7, 8, 9.
The hm software leverages the capabilities of Graphviz dot, which incorporates
modern graph layout algorithms. The layout produced by Graphviz dot for this
example is unambiguous, but the arcs do cross in several places. The following
command creates a simple chronological DAG that represents this stratigraphic
situation.
(run-project/example :complex-h-structure)
The resulting graphic (fig. 9) has six crossings, all but one of which involves an arc from node 2. The arc from 2 to 6 crosses the arc from 1 to 5; the arc from 2 to 8 crosses the arc from 2 to 7; in addition, the arc from 2 to 7 crosses the arc from 3 to 8, the arc from 4 to 8, and the arc from 3 to 7. The crossings make the stratigraphic DAG somewhat difficult to decipher.
Figure 9: A stratigraphic DAG of Herzog and Scollar’s Figure 9.5a.
In this particular situation node colors, node fill colors, and edges from nodes can be classified by reachability from the problematic node 2. An example can be produced on a Linux setup with the following command.
(run-project/example :complex-h-structure-reachable)
The example uses the Brewer Color accent family to color node 2 green, the
four nodes reachable from it purple, and the nodes not reachable from node 2
orange (fig. 10). In this example the green arcs
from node 2 are easily distinguished from the orange arcs that they cross, which
disambiguates all but one crossing.
Figure 10: Another stratigraphic DAG of Herzog and Scollar’s Figure 9.5a. The colors of nodes, node fills, and edges from nodes are classified by reachability from node 2.
Çatalhöyük
This is a real-world example drawn from the dating program reported by Alex Bayliss, Shahina Farid, and Thomas Higham in Chapter 3 of the book Çatalhöyük Excavations: the 2000–2008 Seasons entitled “Time will tell: Practicing Bayesian chronological modeling on the East Mound.” The example was developed to explore the DAG approach to drawing and analyzing sequence diagrams set out by Dye and Buck in 2015. At that time, the example was chosen because it seemed to be the most interesting of a small handful of excavations that reported both a Harris matrix, in this case one created at an early stage of the project by Craig Cessford, and a Bayesian chronological model. The example here reproduces the DAG’s investigated and reported by Dye and Buck.
The Çatalhöyük site has been investigated since 1993 by Ian Hodder, who introduced it this way in Chapter 1 of the book Toward Reflexive Method in Archaeology: The Example at Çatalhöyük entitled “Developing a reflexive method in archaeology”:
Çatalhöyük is in Central Turkey, near Çumra in the Konya region. The East mound is largely Neolithic in date and had a range of radiocarbon dates for its 20 m sequence from 6400 bc to 5600 bc … Çatalhöyük was first excavated between 1961 and 1965 by James Mellaart … and became of international importance because of its size and complexity at an early date outside the Fertile Crescent—i.e. outside the heartlands of animal and plant domestication in the Near East. But the importance of the site transcended these factors because of the sculpture and painting found at the site. Indeed, the site has retained a central significance despite the discovery in the last thirty years of large complex sites at earlier dates in Turkey and the Near East. It is the art which has won for Çatalhöyük this continued renown.
Excavations at Buildings 1 and 5 on the East Mound, which provide the materials analyzed by Bayliss and colleagues, yielded a deep, complex sequence. Importantly, the sequence was put into Harris Matrix form by Craig Cessford. The stratigraphic DAG based on Cessford’s matrix can be created with the following function call:
(run-project/example :catal-hoyuk)
The example project creates a stratigraphic DAG and a chronological DAG, which are shown in Figures 11 and 12.
Figure 11: Stratigraphic DAG of the North Area sequence based on a Harris matrix created by Craig Cessford.
Figure 12: Chronology DAG based on residuality determinations of Alex Bayliss and colleagues. Note the situation for Context 1332+ at the top left, with the dangling θs.